How We Got Here — The Science Behind Our Striper Migration Forecast
Every fall, striped bass that spent the summer in Massachusetts head south toward New York, New Jersey and the mid-Atlantic. Our fall-run forecast tries to tell you roughly when that push is getting started and roughly when it might reach your stretch of coast. This page explains where the numbers come from. It also separates what scientists have actually measured from the choices we made to build a forecast.
The short version
- What the science shows: In a Massachusetts bay tagging study, most striped bass had left by the time the water reached about 16.8°C (62°F) and daylight had dropped to about 11.6 hours.
- What we do with it: We watch NOAA's Boston buoy (station 44013). When its 7-day average water temperature is 62°F or cooler on or after October 1, we treat that as the signal that the main southward push is underway.
- What we assume: After that signal, our forecast moves the "front" of the run south at 15 miles per day. That pace is a forecasting assumption that we chose. Nobody has measured it. Tagged fish don't swim south at one steady speed.
- What it isn't: It's not a promise that fish will be at your beach on a given day. Striped bass leave at different times, take different routes and stop to feed along the way.
1. Where the 62°F number comes from
The main source is a University of Massachusetts Amherst–led acoustic tagging study in Plymouth, Kingston and Duxbury Bay, about 30 miles south of Boston (Hollema et al., 2017, Fisheries Research).
- In 2011, researchers fitted 35 striped bass (38.5–80.5 cm, about 15–32 inches) with acoustic transmitters. A network of 34 underwater receivers tracked them from May to late October.
- Most of the tagged fish stayed in the bay for the summer. Residence times ranged from 6 to 75 days, and the fish then left for their southward migration.
- Whether a fish was still in the bay was significantly related to both water temperature and day length. The study's model put the 50% point (the point where a tagged fish was as likely gone as present) at about 16.8°C (62.2°F) and 11.6 hours of daylight.
- Tagged fish that left were later picked up by receivers farther south, including in New Jersey.
What that does and does not mean
- 62°F is the temperature at which the bay's tagged fish were about half gone. It isn't a temperature at which every striper leaves.
- It comes from one bay, one year and 35 fish.
- Day length mattered as much as temperature. Daylight in Massachusetts drops to about 11.6 hours in early October every year. That's part of the reason we only start looking for the trigger on October 1.
2. Why we use the Boston buoy, and why that's our choice
The bay study measured water inside a shallow, sheltered estuary. We use NOAA buoy 44013, which sits in open water about 16 nautical miles east of Boston. We picked it because it reports every hour and has a long public record.
Those are different environments. Shallow bays usually warm faster in summer and cool faster in fall than open water. So 62°F at the offshore buoy is not necessarily the same moment as 62°F inside Plymouth–Duxbury Bay. Using the buoy as a stand-in for the conditions the bay fish experienced is our modeling assumption, not a finding of the study.
We added the October 1 rule ourselves for two reasons. It lines up with the day-length half of the study's result, and it keeps a short September cold snap or upwelling event from setting off the trigger too early. In 3 of the last 11 years (2017, 2020 and 2022), the buoy's 7-day average briefly dipped to 62°F or lower in late September.
3. Eleven years of Boston buoy data
We pulled NOAA's hourly water temperatures for station 44013 from 2015 through 2025, averaged them by day, and then took a trailing 7-day average. For each year, the table shows the first day on or after October 1 when that 7-day average was 62°F or cooler.
Median trigger date: October 12. Range: October 1 to October 22.
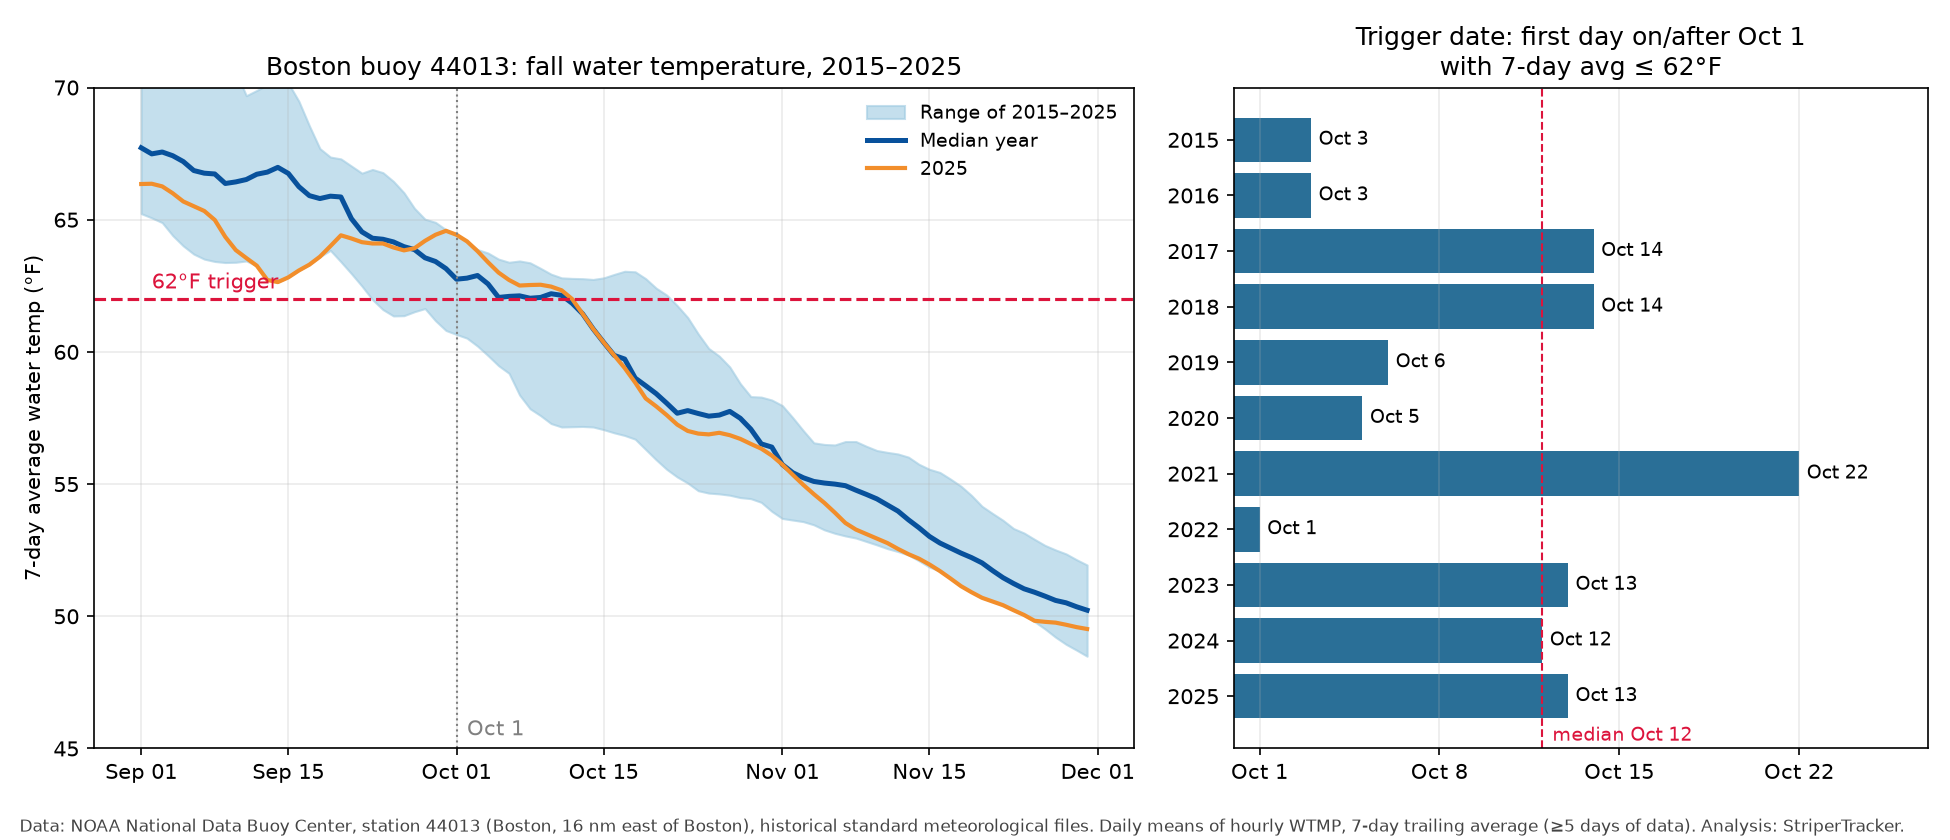
| Year | Trigger date (7-day avg ≤ 62°F, on/after Oct 1) | 7-day avg on Oct 1 |
|---|---|---|
| 2015 | Oct 3 | 62.7°F |
| 2016 | Oct 3 | 62.5°F |
| 2017 | Oct 14 | 63.5°F |
| 2018 | Oct 14 | 64.0°F |
| 2019 | Oct 6 | 64.2°F |
| 2020 | Oct 5 | 62.5°F |
| 2021 | Oct 22 | 63.9°F |
| 2022 | Oct 1 | 60.7°F (already below) |
| 2023 | Oct 13 | 62.7°F |
| 2024 | Oct 12 | 62.7°F |
| 2025 | Oct 13 | 64.4°F |
For comparison, the same buoy didn't reach a 7-day average of 52°F until November 15–30 in any of those years. An older trigger based on "low-50s" water would therefore have fired well after most tagged Massachusetts fish had already left.
4. What other tagging studies show
Several other peer-reviewed studies tracked striped bass leaving Massachusetts. They agree on the broad pattern, and they also show how much individual fish differ.
- Kneebone et al. (2014), Transactions of the American Fisheries Society. 159 adult striped bass (65–110 cm) were tagged in Massachusetts waters and tracked from 2008 to 2012. The fish were present north of Cape Cod each year from May through November. They moved in and out through the Cape Cod Canal and along the east side of Cape Cod. 79% were detected outside Massachusetts, migrating to mid-Atlantic wintering areas and to the Chesapeake, Delaware and Hudson spawning grounds. The study also found that Massachusetts' summer fish come from several different spawning stocks.
- Mather et al. (2010), Journal of Fish Biology. 46 young adult and sub-adult striped bass were tagged in Plum Island Estuary, Massachusetts, in 2006. About three-quarters were detected farther south in the fall. Roughly half were detected only in Long Island Sound. The other half reached the Delaware Estuary, some through Long Island Sound and some apparently by a more direct coastal route. The fish were tagged at the same time and place, and they still ended up in different places, took different routes and left at different times.
- Secor et al. (2020), PLOS ONE (Hudson River fish). Hudson River striped bass spent summer in Massachusetts until about late September. After leaving, they moved south at an average of about 6 km (3.7 miles) per day and reached Virginia waters in early to mid January.
- Secor et al. (2020), PLOS ONE (Potomac River fish). Large Potomac River striped bass stayed in Massachusetts waters from June through October. Their southward migration took place over November–January, roughly a 90-day period. That's slower than their spring trip north.
5. What we know about timing in New Jersey
The direct New Jersey evidence is thinner, and we want to be upfront about that.
- Able & Grothues (2007), Fishery Bulletin. 68 tagged striped bass were tracked in the Mullica River–Great Bay estuary in southern New Jersey. In fall, departures and arrivals were concentrated from late September to mid November. Few fish moved when inlet water was colder than 10°C (50°F) or warmer than 20°C (68°F).
- Ng, Able & Grothues (2007), Transactions of the American Fisheries Society. The same estuary was tracked with a mobile receiver. Fish movement in the estuary peaked in April, with smaller peaks in October and December.
- The Massachusetts studies above detected their tagged fish passing New Jersey and New York receivers on the way south.
Those New Jersey studies cover estuary fish, some of which may be local. They don't directly measure when Massachusetts fish pass a particular New Jersey beach. We haven't found a peer-reviewed study that gives a typical arrival date for migrating Massachusetts striped bass along the New Jersey ocean beaches.
6. Our 15-mile-per-day pace: a modeling assumption
The 15-mile-per-day pace is a forecasting assumption that we set. It is not a measured swimming speed, and no study has validated it.
Here's how it compares with what has been measured:
- Tagged fish average much slower. The Hudson River fish in Secor et al. (2020) averaged about 3.7 miles per day over the whole trip south from Massachusetts. That average includes days spent feeding and lingering.
- Individual fish differ a lot. Some leave early, some late. Some go through Long Island Sound and some go offshore. Some stop in New York, and others continue to Delaware or Virginia (Mather et al., 2010; Kneebone et al., 2014).
- What 15 miles per day predicts. By approximate coastal route, Sandy Hook is about 250 miles from Boston, Barnegat Inlet about 300 and Cape May about 375. Starting from the median trigger date of October 12, a 15-mile-per-day pace reaches Sandy Hook around October 29, Barnegat around November 1 and Cape May around November 6. Those dates fall inside the late-September-to-mid-November window seen in the southern New Jersey estuary study. That's a rough consistency check, and it doesn't prove the pace is right.
So 15 miles per day is meant to follow the leading edge of the run, the point where good numbers of fish first show up. It doesn't describe how fast any one fish swims. We'll adjust it if better evidence comes in.
7. Limits of this forecast
- No temperature makes every striped bass migrate. Fish of different sizes, stocks and condition leave at different times. The bay study found larger fish tended to stay for shorter periods.
- Bait, storms, wind and local water temperature can hold fish in one area or push them through it fast.
- The trigger is based on one buoy in one place. A warm or cold fall elsewhere on the coast can shift timing.
- The forecast is a planning guide. Local reports and your own time on the water still matter.
Sources
- Hollema, H. M., Kneebone, J., McCormick, S. D., Skomal, G. B., & Danylchuk, A. J. (2017). Movement patterns of striped bass (Morone saxatilis) in a tidal coastal embayment in New England. Fisheries Research, 187, 168–177. https://doi.org/10.1016/j.fishres.2016.11.006
- Kneebone, J., Hoffman, W. S., Dean, M. J., Fox, D. A., & Armstrong, M. P. (2014). Movement patterns and stock composition of adult striped bass tagged in Massachusetts coastal waters. Transactions of the American Fisheries Society, 143(5), 1115–1129. https://doi.org/10.1080/00028487.2014.889752
- Mather, M. E., Finn, J. T., Pautzke, S. M., Fox, D. A., Savoy, T., Brundage, H. M., Deegan, L. A., & Muth, R. M. (2010). Diversity in destinations, routes and timing of small adult and sub-adult striped bass Morone saxatilis on their southward autumn migration. Journal of Fish Biology, 77(10), 2326–2337. https://pubs.usgs.gov/publication/70037711 (DOI: https://doi.org/10.1111/j.1095-8649.2010.02811.x)
- Secor, D. H., O'Brien, M. H. P., Gahagan, B. I., Fox, D. A., Higgs, A. L., & Best, J. E. (2020). Multiple spawning run contingents and population consequences in migratory striped bass Morone saxatilis. PLOS ONE, 15(11), e0242797. https://doi.org/10.1371/journal.pone.0242797
- Secor, D. H., O'Brien, M. H. P., Gahagan, B. I., Watterson, J. C., & Fox, D. A. (2020). Differential migration in Chesapeake Bay striped bass. PLOS ONE, 15(5), e0233103. https://doi.org/10.1371/journal.pone.0233103
- Able, K. W., & Grothues, T. M. (2007). Diversity of estuarine movements of striped bass (Morone saxatilis): a synoptic examination of an estuarine system in southern New Jersey. Fishery Bulletin, 105(3), 426–435. https://spo.nmfs.noaa.gov/sites/default/files/pdf-content/2007/1053/able.pdf
- Ng, C. L., Able, K. W., & Grothues, T. M. (2007). Habitat use, site fidelity, and movement of adult striped bass in a southern New Jersey estuary based on mobile acoustic telemetry. Transactions of the American Fisheries Society, 136(5), 1344–1355. https://scholarship.libraries.rutgers.edu/esploro/outputs/journalArticle/Habitat-Use-Site-Fidelity-and-Movement/991031654602604646
- NOAA National Data Buoy Center. Station 44013, Boston (16 NM east of Boston). Station page: https://www.ndbc.noaa.gov/station_page.php?station=44013 · Historical data: https://www.ndbc.noaa.gov/station_history.php?station=44013 · Annual files used: https://www.ndbc.noaa.gov/data/historical/stdmet/44013h2015.txt.gz through 44013h2025.txt.gz
Methods note: Water temperature (WTMP, °C) from NDBC historical standard meteorological files, missing values (99/999) removed, daily means converted to °F, trailing 7-day mean requiring at least 5 days of data. Route distances are approximate straight-line sums between coastal waypoints (Boston, Cape Cod Canal, Point Judith, Montauk, Fire Island, Sandy Hook, Barnegat, Atlantic City, Cape May), not measured fish paths.